Tutorial: Submitting Appraising Risk Data
After much preparation, the Appraising Risk Partnership is moving into our first stage of exploratory data collection.
Our goal is to collect comprehensive data about human-environment interaction between 1800 and the modern day, though we invite teams to include data as far back as their sources allow.
This guide will outline our data template system and data workflow, while also providing context about the baseline data sets which have already been collected. By combining the data that you will be collecting with our repository of spatial and environmental data, we are hoping to use these test data-sets to provide each team with standardized, clean data that is ready to be used for robust analysis and historical inquiry.
Our Data Template System
In order to standardize and organize data within our framework, we are collecting data in the form of tabular data-sets. We have developed a set of data table templates to make this process easy and intuitive. Our data templates contain rows of historical objects – which are information, items, or events. Each object has a series of data variables – entries for location, year, death toll, and other relevant contextual data. To aid with data collection and standardization, our partners are provided with thematic data templates – easy-to-fill empty spreadsheets with prearranged variables. Teams then fill the rows with historical data extracted from primary and secondary sources.
Step 1 – Submitting Data Proposal
The first step is to submit a Data-set Proposal. Please include broad information about the theme, geographic focus, and time period of your proposed data-set. Once it has been submitted to iowc at mcgill dot ca, our team will check for any conflicts or redundancies and send back the appropriate empty data template for your team to use.
Tips on Planning your Data-set
We require that all contributors submit project data as ‘sets’, which can broadly take two different forms. When planning your data-set, consider that each template should hold a full series of data on your stated theme and time period – i.e. if you are submitting population figures for 1800-1850, you can place figures from all of those years into a single data-set, even when the data comes from different sources. The two general outlines for datasets are:
- Data derived from the best available comprehensive primary or secondary sources on a given topic.
- For example: Population Figures from the Indian Census 1872-1941 (assembled using a series of census reports, the best available repository of primary source material related to the topic); Smithsonian Global Volcanism Project (a high quality secondary source, compiled by experts and freely available for academic use). This type of data-set involves simply translating or transposing data from existing data-sets into our template system.
- Data sets compiled by the researcher, consisting of the best available data on a topic, derived from multiple primary sources.
- For example: You can download and view Gwyn Campbell’s Madagascar Population Data, 1600-1900 (assembled using a diverse collection of primary source material). This is a great example of this second type of data-set.
- Regardless of the source material used, a complete data set should cover the following:
- One topic (Population, Disease, Cyclones, Migration etc.)
- A substantial (and clearly defined) geographic area such a country, province, region, etc.
- At least one of the Partnership’s core periods of study:
- 530 – 800 CE
- 1330 – 1370 CE
- 1630 – 1660 CE
- 1780 – 1820 CE
- 1880 – 1900 CE
- 2000 CE to Present
- The key idea here is that the data submitted should be complete enough, and of a high enough quality, that it will not be necessary for other researchers to revisit the same topic at a later date. A data set covering, for example, “India Cholera Mortality, 1880-1900” should only be submitted once a researcher is confident that they have assembled the best data available on the topic.
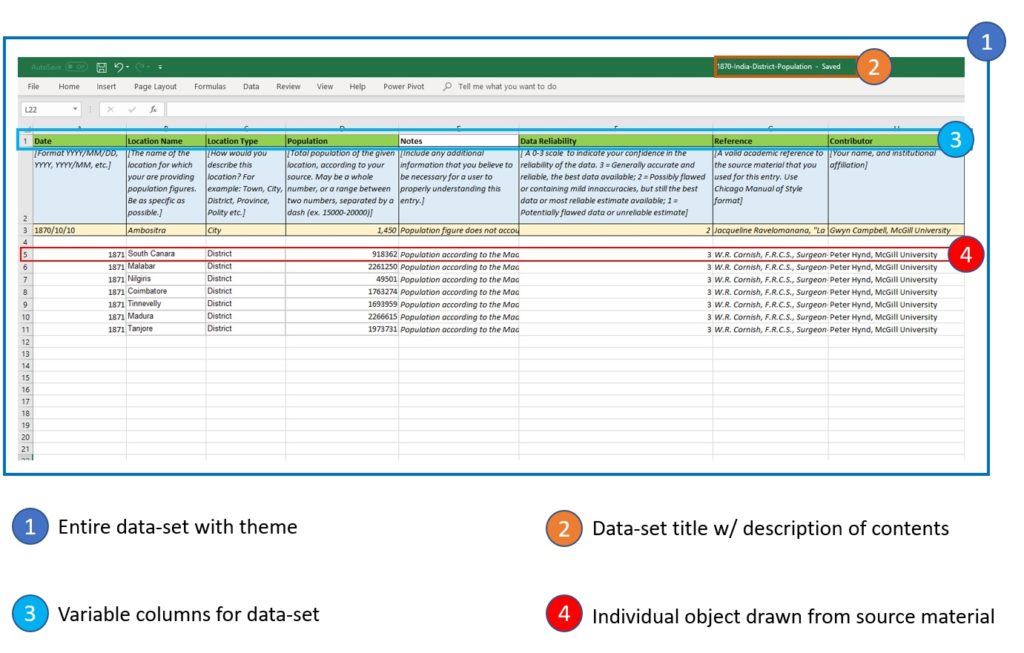
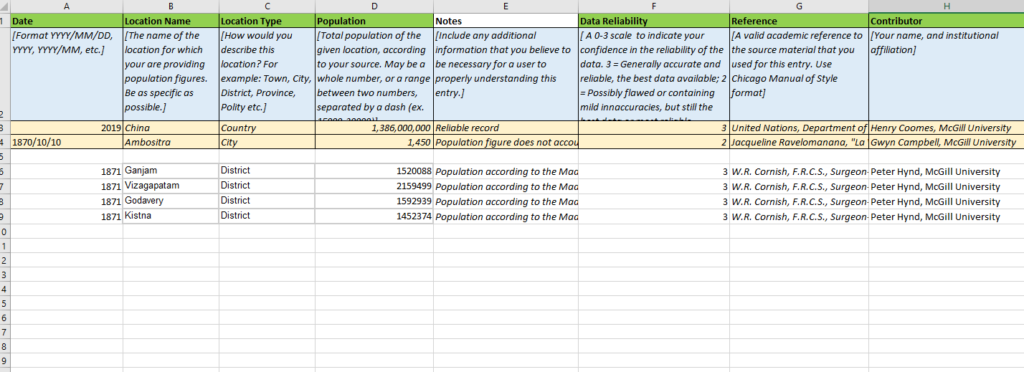
Below you can see an example of an empty population data template. Note that the variables (row 1) have already been established, allowing your team to collect sources and extract data into our standardized template. Row 2 contains information about the correct formatting of data – which we will revisit in the next segment of this tutorial. Row 3 includes an example object that you can use to reference the kind of data formats we are looking for. In this case, the population figure is for the entire country of China, but you can easily enter the entire population of a Village or a Town in the same data-set.
Step 2- Examine Your Data Template
When you receive a data template, it is important to first note the variables that are present. These variables will change depending on the type of data you are collecting. For example, an earthquake data template will include a variable called Magnitude, and a disease template will include variables like Deaths and Disease Type.
In order to use these data templates, they must be opened in a tabular data program such as Microsoft Excel or Google Sheets, if you would prefer to use an open source tabular data program, this guide has multiple useful alternatives.
Step 3- Assemble Source Materials
Once you have you have submitted your data proposal and received your data template files, you can begin to assemble your sources and plan out how to extract the data you need.
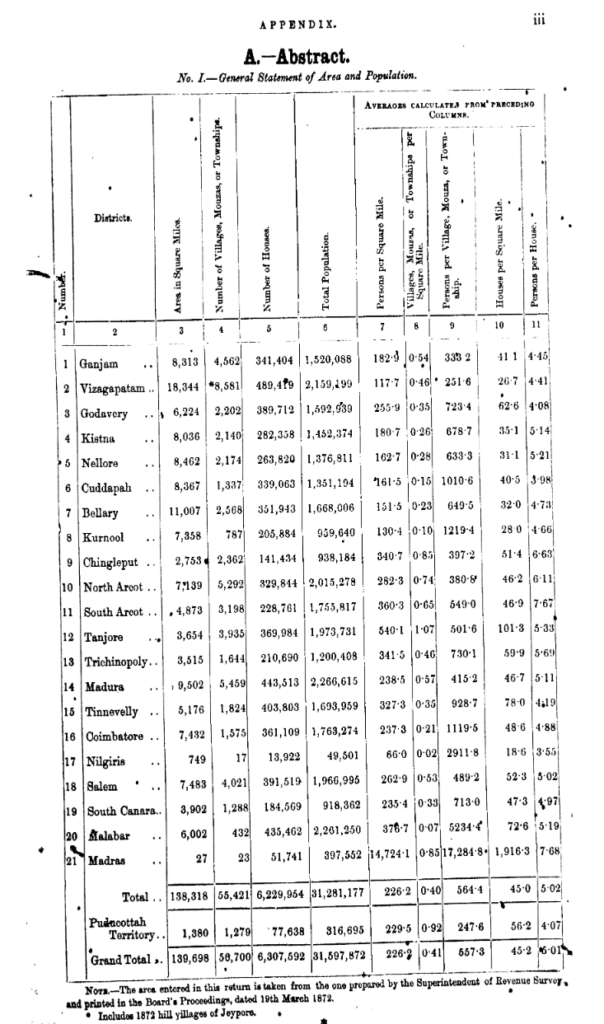
In this example, we will use a page from the Indian Census of 1872. It is a great example of a document that contains rich amounts of historical information which can be extracted into a data-set and added to the Appraising Risk database for other scholars to analyze and make use of.
Step 4- Extract Data to Template
When approaching a source like this, you will need to identify the elements that will become Objects and the elements which can be matched with Variables. Let’s break this document down to its elements and then convert it into our data- set. To begin with, we can assume that we are collecting population data for each location named in our table, but often it is necessary to select the correct data to fulfill the Variables.
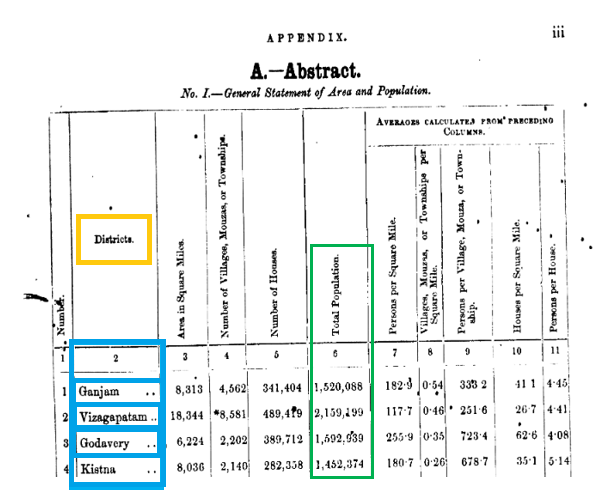
Here are our variables from the data template:
Date – we know that this census is from 1872
Location Name – The names in the Blue boxes
Location Type – We can see that these locations are Districts from the Yellow box
Population – We can find the ‘Total Population’ column in the Green box
Notes – We can note that the document contains other spatial information
Reliability – I’d judge these documents as a 3 – the best information available
Reference – We can reference this as we would any other historical document
Contributor – That’s you!
Below, we can see the same information as it is entered into the data template.
The above example shows only a small selection of data extraction, to view an example of a finalized, large-scale data-set, you can download and explore Professor Gwyn Campbell’s Madagascar Population Data-set.
Step 5- Create Accompanying Essay
Researchers should submit data sets with an accompanying essay that provides any contextual information necessary for users to understand the attached data
Step 6- Submit to the IOWC
Once you have completed your data-set, you can submit it to the IOWC by emailing your filled-in template and accompanying essay to iowc at mcgill dot ca. Eventually, we will have a system to submit data directly into our database, but currently it must be submitted to that email address. Once you submit a data-set, it will be reviewed by a member of the IOWC team before being uploaded into our system.